


Today Microsoft is hosting an online event called Data Amp to share how to make the most of data to accelerate the pace of business innovation. Internally, we run every aspect of the company using data, providing the power of data to every employee. We refer to this as our “Data Culture”. As the lead for BI and analytics for James Phillips, the Corporate Vice President that leads the Business Applications, Platform and Intelligence (BAPI) organization, I am often asked how Microsoft uses Power BI and analytics to run its growing cloud business.
With this post, I would like to start sharing our best practices with the internal story of Microsoft’s BAPI organization, which has thousands of team members across the globe. James’ teams build and operate a wide range of products and services. They include Azure App Service, PowerApps, Microsoft Flow, Azure Portal, the Dynamics ERP family of products (AX, NAV, GP and SL), and Microsoft's business intelligence product line — including Power BI, Power BI Desktop, Power BI Mobile (iOS, Android and Windows apps), and SQL Server Reporting and Analysis services.
Executive Dashboards
Running BI and Analytics for James Phillips, the same leader that owns our portfolio of BI products, is no easy feat! On my first day he explained the strategy we have for BAPI, and challenged me to surprise him with a concept for a data fabric to run such a vast organization. We had just a few weeks of time and a couple of resources to start. Luckily, we did not have to select the tools, as Power BI and a range of Azure services had everything we needed.
We built a system of widely used dashboards all driven off a single dashboard that provides a 360 degree view of the business, called BAPI KPIs:
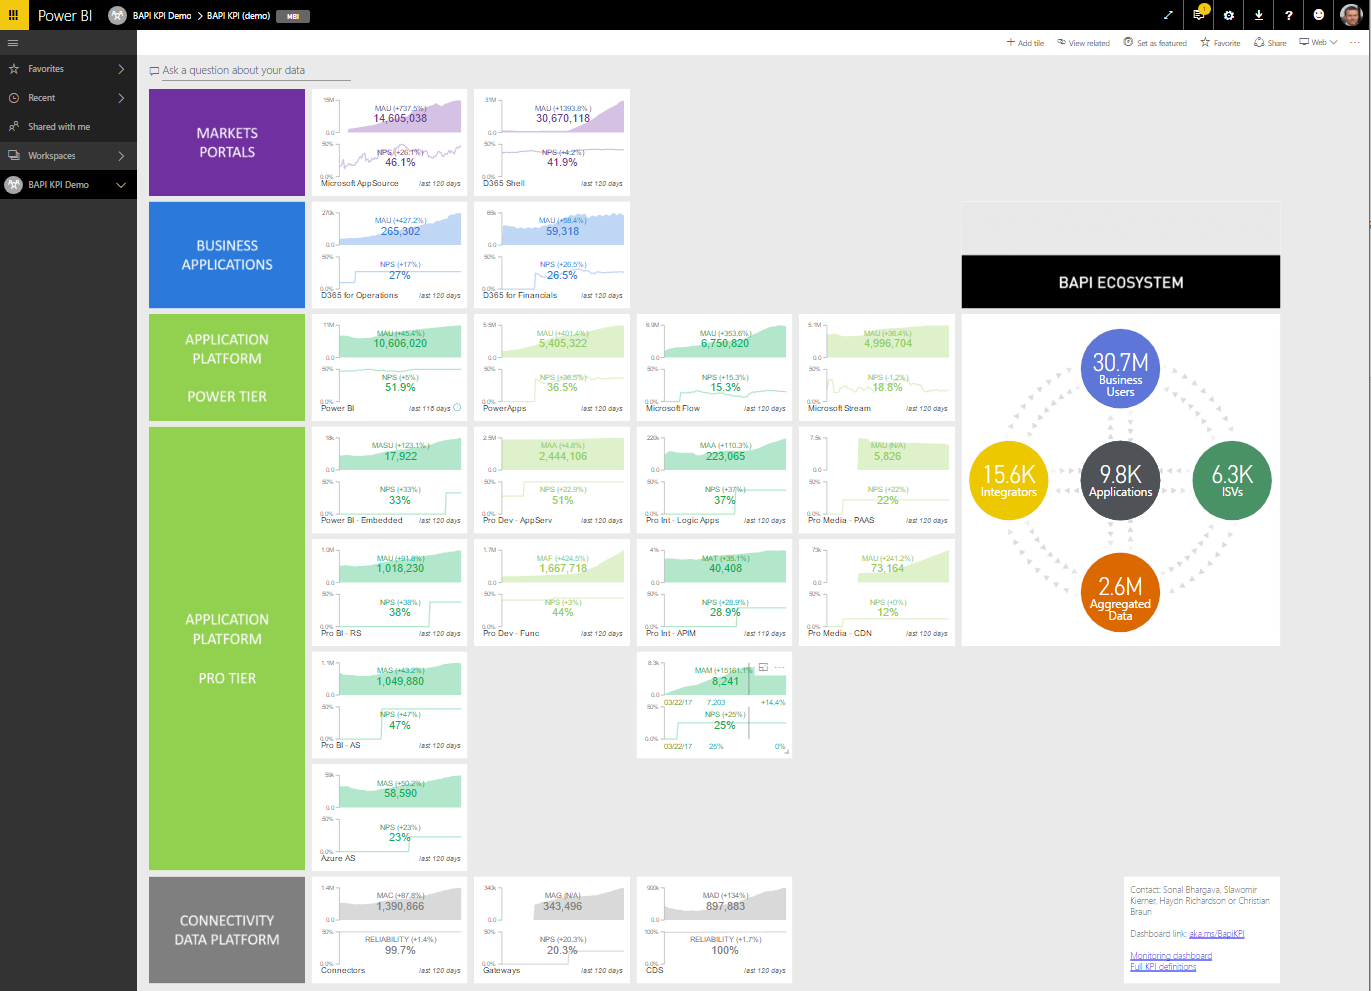
Visual 1: Data and trends have been obfuscated. Click image for more detail.
This is our main dashboard, seen and used constantly by the vast majority of James’ organization. Every tile here depicts a product, and for every product there's a GM who drives two metrics: usage, and user satisfaction, most often measured by Net Promoter Score, or NPS. We wanted this dashboard to be used on PCs and hallway monitors, so we optimized for both high quality visuals and information density. On top of a wide range of standard and community visuals, Power BI allows for easy development of custom visuals, and in just a few weeks we developed a ‘Dual KPI’ custom visual, which is now available in the gallery for everyone to use.
As we prepared for our grand reveal, we considered our audience. What does James do every morning and every evening? He looks at these numbers. But where does he look at them? On his mobile phone, of course.
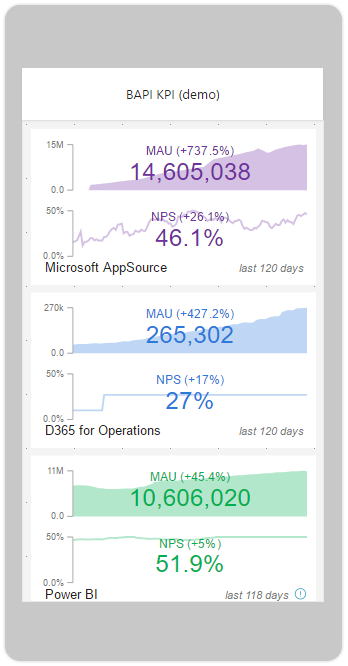
Visual 2: BAPI KPI Dashboard we use, but actual data and trends have been obfuscated
Once you have your PowerBI dashboard ready, it is immediately available on all smartphone platforms, and with less than 10 minutes of extra work you can create a completely customized mobile optimized version. Executives love to have this live access to their dashboards via mobile – we know from experience that they glance through the numbers with almost addictive passion.
James may also want to inspect every business in more detail. Across our organization we have a lot of data, so in order to avoid a “boundless sea of data” where users get lost finding what they are looking for, we spent some time coming up with an appropriate information architecture. We defined core KPIs that are relevant to all products in the organization for the top-level dashboard, and product-specific KPIs for product dashboards. Each product has a full dashboard that is easily accessed by selecting any of the associated tiles.
Data for Everyone
We created a few of these product dashboards initially, and defined a standard layout for everyone to use. These dashboards look at essentially all of the content needed to run a thorough product review, including overall usage, engagement, partners, content, delivery velocity of new features, service quality, and NPS. Our dashboard ecosystem is powered by hundreds of data streams coming from many different sources from many databases and technologies, including HDInsight and Azure Data Factory, Azure Data Lake, quite a few directly from SQL Azure, and some through multiple Enterprise Gateways as well as from Excel files on SharePoint.
I've talked about James, but keep in mind that whatever the organization's leader wants to see, everyone wants to see. So we gave access to all of our organization, effectively giving thousands of people a look at the same view of data. We’ve found that when people look at the same data, they understand the decisions better, they collaborate more, they do not need to waste time searching for data, and they are more productive. This also greatly enabled our Advanced Analytics efforts, as data scientists now have well described, clean, and maintained data streams to start with for ML projects.
At Microsoft, we can clearly see the influence this dashboard ecosystem has had on our culture, the quality of data, and on data reuse between teams. People agree faster as they all look at same data, and everyone is clear about their focus and performance, while also expanding data science and experimentation. When everyone in the organization, from executives to analysts, is looking at your data daily, it helps inspire us to maintain a high quality of content and presentation.
Imagine what this all could mean for your own organizational data strategy!
To hear more about how we incorporated Power BI, see me speak at the Big Data Innovation Summit in SF on April 19th and then in our own Microsoft Data Insights Summit on June 12th.
Slawomir leads business intelligence, data science and advanced analytics for the Microsoft BAPI Engineering group. Until 2015 he served as a Director of Consumer Intelligence at Microsoft after 11 years with Procter and Gamble, where among other assignments he was a CIO in Central Europe, spearheaded use of Business Analytics and led all digital marketing and CRM operations in 100+ countries of EMEA. He enjoys speaking and writing about enterprise data transformation, data science and NPS.