


There has been a lot of interest in the analytics community in visualizing the output of an Azure Machine Learning model inside Power BI. To add to the challenge, it would also be great to operationalize Azure ML models through the Power BI service. Imagine if you could have Power BI regularly bring in the latest output of your fraud model or the sentiment for recent Tweets about your products. The following tutorial will outline a proposed approach for doing just that.
For the purpose of this tutorial we will assume your data is sitting inside an Azure SQL database. You can tailor this example to the data source of your choice, like a local CSV or an on-premises SQL. The secret sauce for this tutorial is the R integration inside Power BI, which acts as a glue between the two services. On top of Power BI and an Azure ML subscription, you will therefore also need to download R and (optional but recommended) an R GUI like RStudio or RevR. In this example we will be using RStudio.
This example will use the Titanic dataset, a well-known tutorial dataset. The purpose will be to use data like gender, passenger class, and departure port to predict how likely someone would have been to survive the Titanic disaster.
Workflow
By the end of the tutorial we will have set up the following workflow:

The high level steps we will be performing are as follows:
- Use R to extract data out of Azure SQL that has not yet been scored by our ML model
- Use R to call the Azure ML web service and send it the unscored data
- Write the output of the Azure ML model back into SQL
- Use R to read scored data into Power BI
- Publish the Power BI file to the Power BI service
- Schedule a refresh of the data using the Personal Gateway (which triggers a scheduled re-run of our R script and brings in new predictions)
Set up Azure SQL
We will start out with configuring our SQL environment. If you are starting from scratch please log into the Azure portal and spin up a new Azure SQL and database. You will also need to safelist your server’s IP address so that R is able to read and write data into the database. If you have an existing environment with existing data, feel free to use that instead.

Once your Azure SQL is all ready to go you will need to connect and create two tables: one for your original data and the other for the output of the machine learning model. The schema of the two tables is almost identical, with Table #2 simply having a ‘Scored Probabilities’ column appended to the end of it. If you are starting out with existing data, then please just create a blank second table using the above schema definition.
If you want to follow the Titanic tutorial we will need to get some data into our newly created Azure SQL table. A quick and easy way to do that is to actually use Azure ML’s ‘Write’ module and the Titanic dataset. Run the following experiment inside Azure ML to quickly get some data into your SQL:

Publish Azure ML experiment
Fortunately, there already exists a Titanic tutorial experiment inside Azure ML and so we will be able to leverage that for this tutorial. You can find it here:
Once you have access to the experiment, run it to ensure everything is working correctly. You can go ahead and hit the ‘Set up Web Service’ at the bottom of the screen.
You should now be in front of your predictive experiment. We will need to make a couple of tweaks in order to have our web service write our newly calculated Scored Probabilities into our SQL:

- In our predictive experiment, the first step of the flow drops four columns. We will move this step to the bottom of the workflow, right after the last ‘Edit Metadata’ module and just before the ‘Score Model’ module.
- We will then add another ‘Select Columns’ module and attach it to the last ‘Edit Metadata’ module. We will drop everything apart from ‘PassengerId’, ‘Name’, ‘Cabin’ and ‘Ticket’
- We will attach it to an ‘Add Columns’ module and bring back the rest of our data along with the newly calculated ‘Scored Probabilities’.
- Finally, we will use the ‘Export Data’ module to move our data back into our Azure SQL table. Please make sure you write it into your second database table reserved for the ML experiment output.
Call Azure ML web service using R
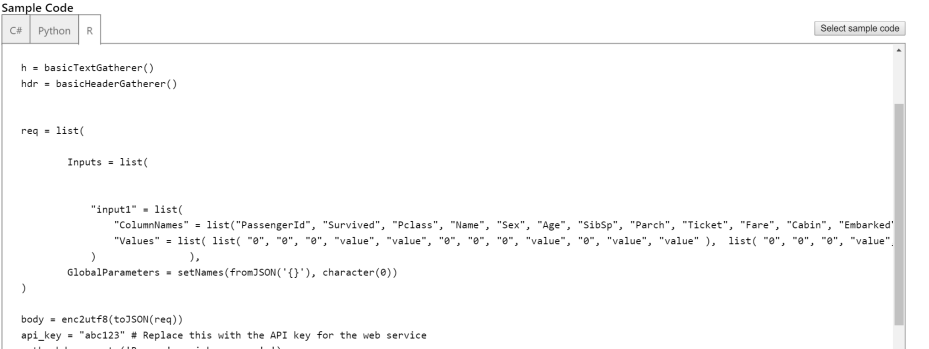
Now that you have configured your experiment so it writes back to SQL, we can write our R script to call the Azure ML web service. Azure ML actually helps you out quite a bit here by providing sample code you can use. From the web services tag, navigate to the Request/Response link and navigate all the way to the bottom of the page. There you will find the sample R code you can use to get you started.

If you are using SQL you will need to create an ODBC connection between R and SQL. Gregory Vandenbrouck has written a great tutorial on how to do that which you can find here:
https://blog.revolutionanalytics.com/2015/05/using-azure-as-an-r-datasource.html
We will use our R code to do the following:
- Bring in your SQL data which hasn’t yet been scored
- Call the Azure ML web service to score the new data
- Read data in from your SQL table (which our Azure ML experiment has outputted results into)
In order to do this, you will need to modify the provided R cod. You can use my existing R code to help out with this as it can be tricky, especially if you aren’t too familiar with R. Then do the following:
- Install and call the libraries needed for the solution (RODBC, RCurl, Rjson).
- Establish a connection to your SQL using the ROBC package (or connect to your preferred data source). I recommend you do an inner join between your two tables and bring in all the records which exist in Table 1 but not in Table 2 (i.e. records that have not gone through your model yet).
- Azure ML requires data to be in a very specific list form instead of the expected data frame format. Here is a quick function that can help you transform your dataframe into the required format:
createList <- function(dataset)
{
temp <- apply(dataset, 1, function(x) as.vector(paste(x, sep = “”)))
colnames(temp) <- NULL
temp <- apply(temp, 2, function(x) as.list(x))
return(temp)
}
- Edit the sample R code and replace the API key and url placeholders with details from your own experiment.
- Finally, you will need to connect to your SQL again and bring in data from your second table which includes all previous + freshly scored data.
Author & Publish Power BI Report
You are now ready to connect to your data inside Power BI! Select the R Get Data connector and paste in your newly created R script.

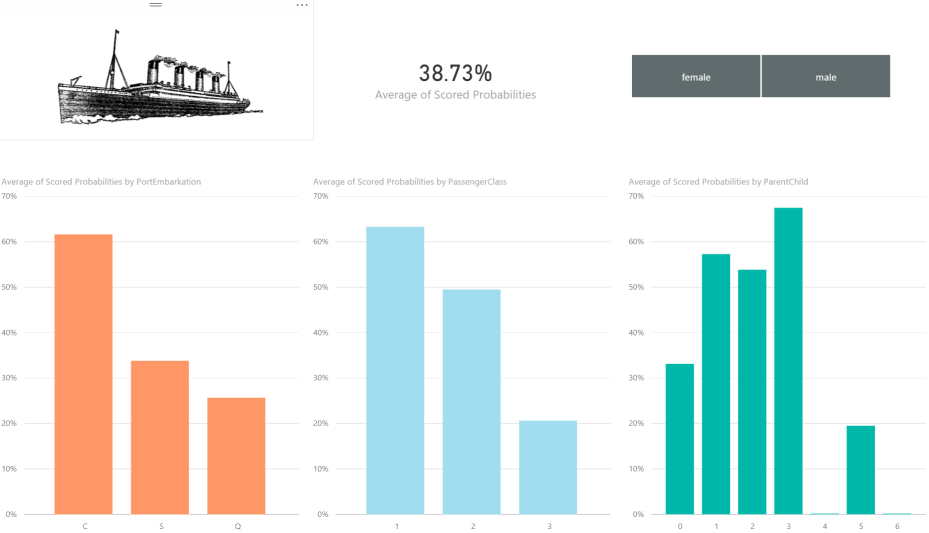
Go ahead, get creative and author some insightful Power BI reports, like my example report. Once you are happy with your report you can publish it into the Power BI service by selecting the Publish button on the top ribbon.
Scheduling a Power BI refresh
You are almost done! The final step is to schedule a refresh of your data so you can always get the latest predictions flowing in. In order for a refresh to work, you will need to enable the Power BI Personal Gateway.
The Power BI Gateway allows the Power BI Service to connect to on-premises sources like your SQL Server or in this particular case an R script. Depending on your refresh schedule, Power BI will trigger a re-run of your R script (locally) and bring in the most up to date data.
For instructions on what the personal gateway is and how to set it up, use this link:
https://powerbi.microsoft.com/en-us/documentation/powerbi-personal-gateway/
You should now be all set. Have any questions, feedback or suggested improvements on the approach? Please leave a comment, I’d love to hear what you think!