


We have an exciting release of Power BI Desktop this month. It includes several formatting features that have been top asks and new Quick Calcs for your measures. We also have several updates to data connectors and two new query editing options.

Here’s the complete list of February updates:
- Word wrap on matrix row headers
- X- and Y-axis font size control
- Cartesian chart minimum category width
- Line chart line thickness and join type controls
- ODBC and OLE DB connectors: support for selecting related tables
- Enhanced Folder connector: support for combining binaries from the Preview dialog
- Unified text & CSV connectors
- PowerApps Common Data Service connector
- Specify the desired column type and locale in column headers type menus
- Easily insert steps in existing queries
For a summary of the major updates, you can watch the following video:
Report view
Word wrap on matrix row headers
Last month, we added word wrap for table headers, and this month we are extending that support to matrix row headers. You’ll see a word wrap toggle under the Row headers card. Once you turn word wrap on, the row headers will word wrap to fill the space they have.
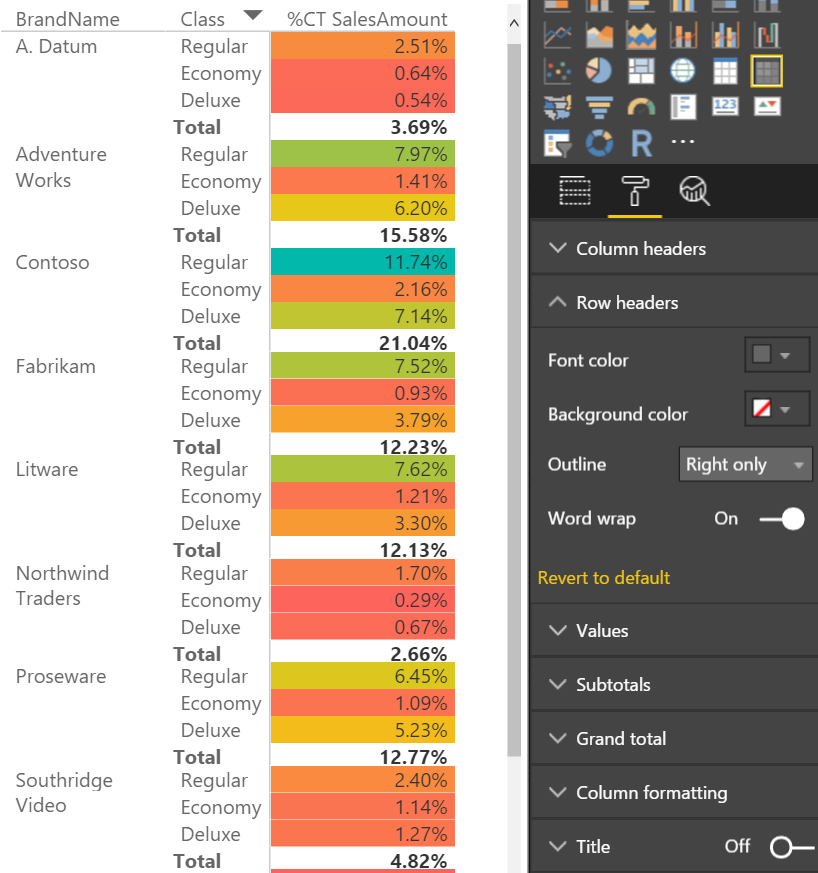
Headers will start to truncate once the available space runs out. This means the lowest level of your row headers will not wrap. We will be improving this experience and adding word wrap to values and column headers in future updates.
Find more details about matrix row header word wrapping in the following video:
X- and Y-axis font size control
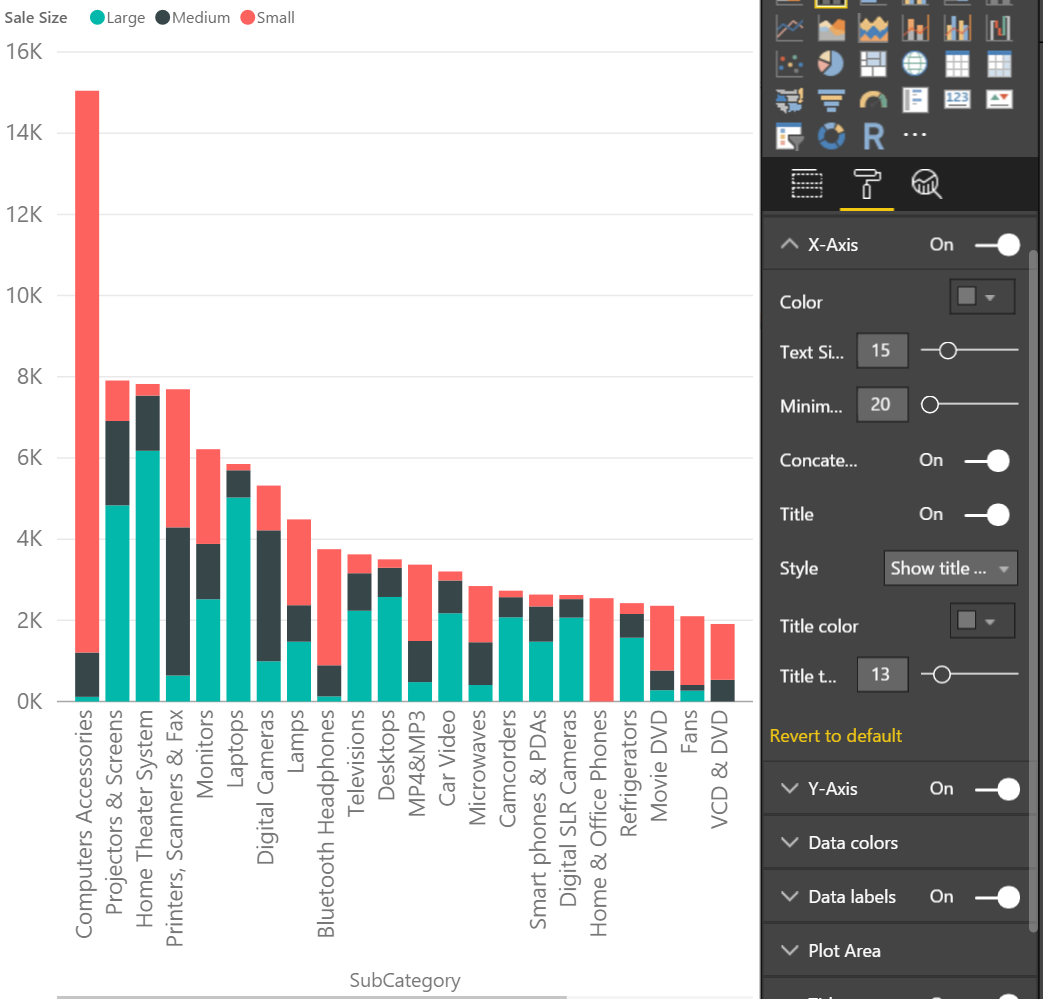
One of the most asked for formatting features we hear is the ability to change the font size for the X- and Y-axis, and with this release, you’ll now find the text size slider under the X-Axis and Y-Axis cards in the formatting pane. By default, the axis labels and title will change size together, but you can use the text size slider under the Title section of the axis card to override this and give the title a different size.
Find more details about the X- and Y-axis font size control in the following video:
Cartesian chart minimum category width
Depending on your data label settings and chart size, you may not see all the data labels on your chart. If you want to guarantee that your data labels show, you can now set the minimum width of categories in Cartesian charts. This is also a good feature to use if you are increasing the font size of the axis on your charts. You can increase your category width in conjunction with the font size to give the larger fonts more room on the axis. You'll find the setting under the X-axis card for column, line, and waterfall charts, and under the Y-axis for bar charts.
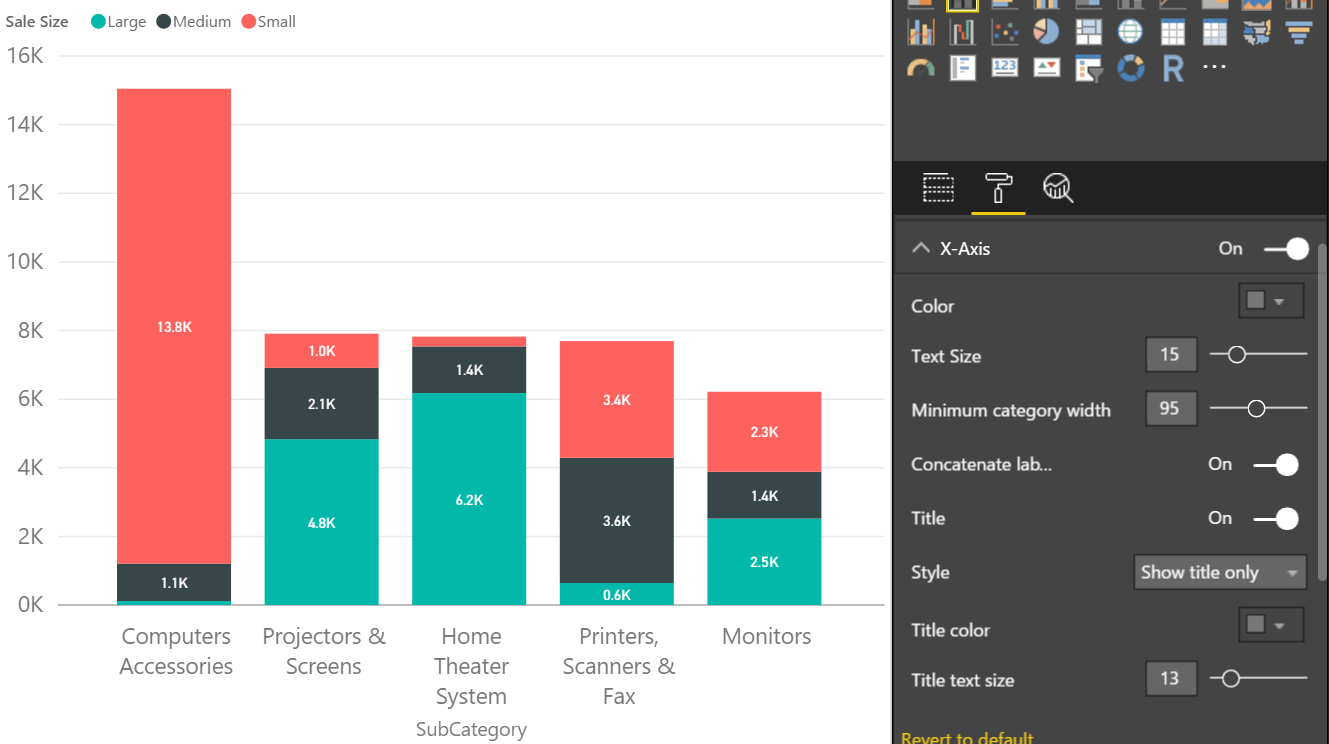
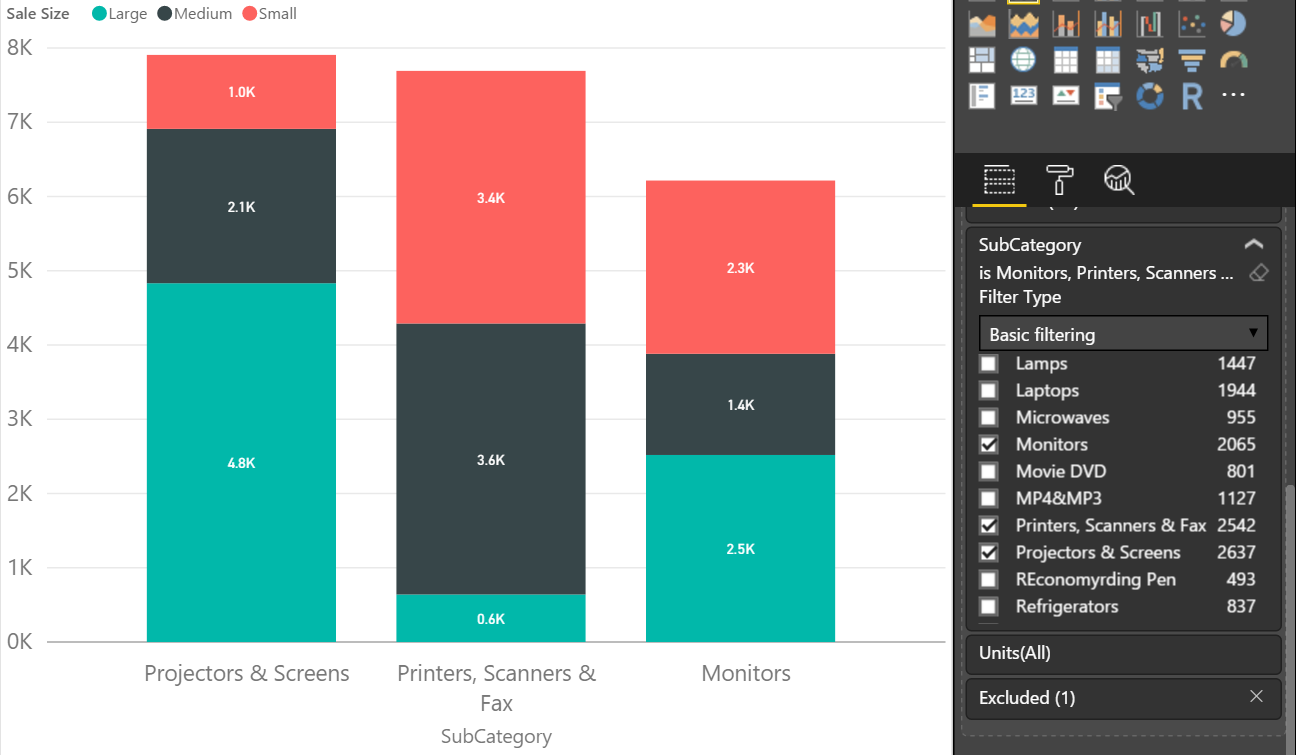
If you use this feature, we will always show the categories at least that wide. We will still use our auto-sizing logic to make the categories bigger than the minimum if wider categories will fit. This means you can set a minimum size that will guarantee your data labels will show, but if you start filtering data out, the chart will still auto-size the categories wider to look better.
Find more details about the Cartesian chart category width control in the following video:
Line chart line thickness and join type controls
With this release, we have a new formatting feature for line charts. Under the Shapes card in the formatting pane, you can use the stroke width feature to make your lines thicker. You can also control the join type. These features are great for both stylistic changes and readability.

Find more details about the Line thickness control in the following video:
Analytics
2 new Quick Calcs: Percent of row total & percent of column total
This month, we have two new Quick Calcs for values in the matrix visual. Now when you open the Quick Calc dialog for Value fields in the matrix visual, you’ll see need two new options.

Under Show value as, you’ll see Percent of column total and Percent of row total in addition to the Percent of grand total we released a while ago.

If you convert a matrix visual to another visual with one of these new Quick Calcs, the calculation will convert these totals into a percent of grand total.
More details about the new Quick Calcs can be found in the following video:
Data connectivity
ODBC and OLE DB connectors: support for selecting related tables
We have enabled the Select Related Tables button in the Navigator dialog when using the ODBC and OLE DB connectors. This option, which is available for other relational data sources already, allows you to easily select tables that are directly related to the set of already selected tables in the Navigator.

Find more details about this ODBC and OLE DB connectors update in the following video:
Enhanced Folder connector: support for combining binaries from the Preview dialog
In the November release, we shipped a set of enhancements to the Combine Binaries experience. You can learn more about those enhancements in this article.
This month, we’re making it easier for you to reach the Combine Binaries feature. You can choose to combine multiple files from the folder preview dialog within the Get Data flow, bypassing the Query Editor.
Note that we’re exposing multiple options (Combine, Combine & Load) to allow you to further refine your data before loading it into the data model.
Find more details about the folder connector improvement in the following video:
Unified text & CSV connectors
With this month’s release, we’re unifying the entry points for importing Text and CSV files into a single Text/CSV entry point. This new entry point can be found in the Get Data dialog, under the Files category.

Upon selecting this option, the Open File dialog allows you to select files with TXT, CSV, or PRN file extensions by default, or any other file extension by switching to the All Files (*.*) filter option.
Find more details about the unified text and CSV connectors in the following video:
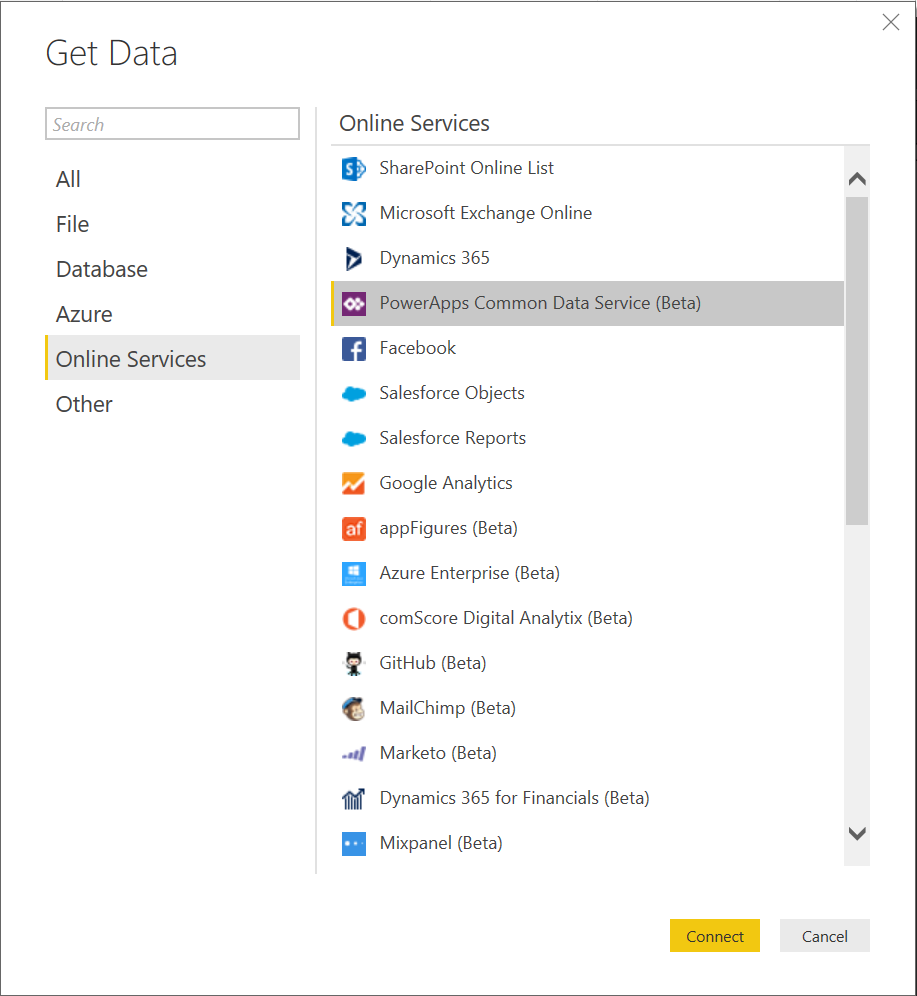
PowerApps Common Data Service connector
We are very excited to announce the PowerApps Common Data Service connector. You can now pull your Common Data Service data into Power BI and build reports to share with others.
Some of the great features that come with this connector include:
- Near-real time data
- Security roles defined in the Common Data Service
- Auto-generated semantic models, which present data by subject area
- Semantic models automatically updated when entities are extended in the Common Data Service
This connector can be found under the Online Services tab of the Get Data dialog box.
Once you select Connect, you'll be asked to sign in with your organizational account.

Once you sign in and select Connect, you'll be asked to choose the environment to connect to.

Next, select the perspective that contains the data you want.

We will now connect to the data and you can start building your reports to share.

The Common Data Service connector is currently in preview and only available to a segment of users in the United States. If you want to be part of the preview and aren't currently, you can request access by emailing: CDSPowerBIPreview(at)Service.Microsoft.com. In addition to being part of the preview group, to use this connector, you'll need to:
- enable the Power BI integration in the PowerApps admin portal
- have maker permissions in PowerApps
- sign in to PowerApps at least once
If you want to learn more about the Common Data Service and the connector, check out the PowerApps blog or check out the Common Data Service and PowerApps documentation. As you try out this new connector, be sure to let us know if you have any questions or feedback!
Query editing improvements
Specify the desired column type and locale in column headers type menus
In the Query Editor, it's possible to see and modify column types by using the Type menus in the preview area. However, before this release, you couldn't change type by locale via these dropdown menus. This option allows you to specify the desired column type and locale to use for the conversion, which affects how text values are recognized as other data types (such as dates, numbers, etc.).
With this release, we’re adding Using Locale to the column header type menus for easier access to this capability, which has been a popular idea in our Power BI Feature Suggestions forum.

Find more details about the update to the column headers type menu in the following video:
Easily insert steps in existing queries
We’ve added a new context menu option to easily insert new steps in existing queries. Insert a new custom step after the currently selected step (which can be the final step or any previous step within the query).

Find more details about the update to the new steps pane option in the following video:
Other
Solution Templates and Partner Showcase quick access
We've added quick access on the ribbon to two great resources: Solution Templates and the Partner Showcase. Solution templates let you use a wizard to very quickly and easily create a working end-to-end enterprise-ready Power BI solution. The Partner Showcase lets you browse our certified partners, see their work, and reach out if you are interested in working with them. If you're looking for resources to work with when creating your Power BI solutions, be sure to check these out!

Find more details about the new resources in the following video:
That’s all for this month! We hope that you enjoy this new update and continue sending us valuable feedback about our product. Please don’t forget to vote for other features that you would like to see in the Power BI Desktop in the future.