


Today we’re releasing the October Power BI Desktop update, which is filled with several exciting new features! We’ve added several new reporting features, including the much asked for date slicer and snap to grid. We also are releasing several new analytical features including grouping and a top N filter.

Here’s the complete list of October updates:
- Date slicer
- Report gridlines and snap to grid (Preview)
- Data label improvements
- Map formatting options
- Improved date axis range formatting
For a summary of the major updates, you can watch the following video:
Report View
Date Slicer
Slicers are a great way for report authors to give their users a tool to quickly slice and dice the data they are seeing in a report. One of the top requests we’ve heard from customers is to more easily filter a report based on dates. In this release, we’re improving the existing slicer to do just that with a new slicer layout called date slicer.

To add a date slicer is very simple. You use the standard slicer, and add a date field to it. When you do this, by default the slicer shows as a date slicer that lets you set the start and end date for your date. You can either use the sliders to set the dates or pick the date using a calendar.

You can also change the mode to Before or After if you only need to control the last or first date used on your report page.

Or switch back to the standard List view.

More details about the data slicer in the following video:
Report gridlines and snap to grid (Preview)
A critical task for authoring a beautiful Power BI report is to make sure your visuals are lined up and look organized. While you could do this in the past by manually entering in X and Y coordinates on each visual or using the arrow keys to nudge visuals into place, this is a time-consuming task. We’re excited to announce a preview of gridlines and snap to grid in Power BI Desktop, as requested by many of our users. This feature will allow you to enable gridlines on your report canvas while authoring, as well as the option to enable snapping to those gridlines.

To enable the preview feature, navigate to File > Options & Settings > Options > Preview Features. Check the “Gridlines and Snap to Grid” box and restart the Desktop.

You’ll find the gridlines and snap to grid options in the View tab of the ribbon. You can choose to turn on one or both options to help you arrange your charts.
More details about gridlines and snap to grid in the following video:
Data label improvements
In this release of Power BI Desktop, we’ve added several new data label capabilities to column, bar, and waterfall charts to help you design your visuals with labels that look great.
First, if you try to turn on data labels and none show, we’ll let you know right away and suggest some ways to fix this.

For column charts, you now have the option to change the orientation of your data labels between horizontal and vertical. This will help you fit longer data labels when you have skinnier columns.

In addition, for bar, column, and waterfall charts, you can also change the position of the data labels so they will show up at specific locations.

And finally, for bar and column charts that have a continuous axis, you can control how dense the data labels are, so you can show less or more data labels on the visual.

More details about the data label improvements in the following video:
Map formatting options
We’ve added two new formatting options to the Bing Maps visual to help you customize your maps even further.
Depending on your data, the bubble sizes on the Bing Map control can sometimes end up being very small and hard to see. There’s a new card in the formatting pane on the map visual that allows you to control the size of the bubbles.

Our maps have a great feature where the zoom level of the map adjusts to show all the data on the map in the best way we can. However, sometimes depending on the data, you might want to specify your own zoom level. This month, we’ve added the capability to disable auto zoom on the map and filled map visuals. This will allow you to set the zoom level and have it stick, even if you are cross-highlighting the data using other visuals or slicers on the report.

More details about the map improvements in the following video:
Improved date axis range formatting
When you have a measure or date on an axis, you can modify the start and end value of the axis in the formatting pane. With this release, we have improved the experience for dates by letting you modify the start and end dates of your axis using a date picker. This makes setting your axis range much easier and faster than it was previously.

More details about the data axis range improvement in the following video:
Analytics
Grouping
In this release of Power BI Desktop, we are introducing the ability to group up points on your visual to help you more easily explore and analyze related categories.
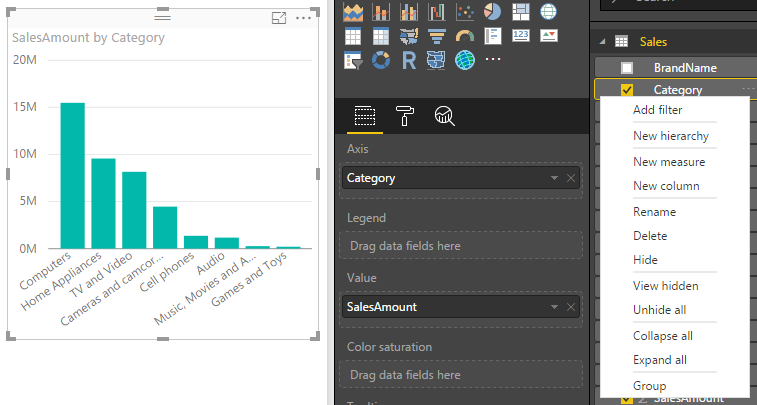
To use the feature, select one or more points on a visual using Ctrl+Click, right click one of the points, and select Group from the context menu.

When the group is created, it’s automatically added to the legend bucket of your visual as well as the field list. You can also find the new grouped field in the field list and use this new field just like any other field in visuals, including using it as the axis in charts.

You can edit existing groups by right clicking an already created group and selecting Edit Groups… from the context menu.
In this dialog, you can create, manage and remove groups. You can also decide whether non-grouped categories should be bucketed into an Other group or if they should remain ungrouped.

You can also create a new group from scratch using the right click menu and selecting Group…
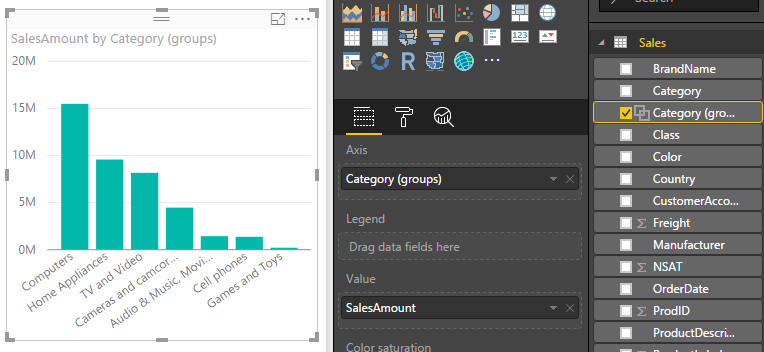
We also allow you to create a group from the Field Well.
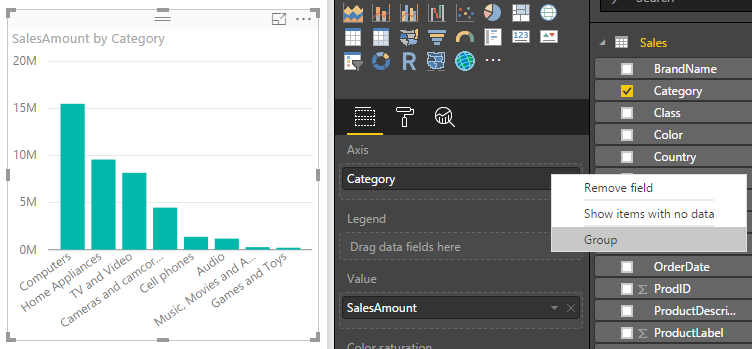
When you do this, it replaces the the field in the axis with the new group.
More details about grouping in the following video:
Binning
In addition to grouping categories together, you can also now use binning on numerical and time fields. For example, if you have a SalesAmount field in your data and you want to see the user satisfaction across different sale sizes, you can use binning to create these sale size groups. You can access binning by right clicking on the field and clicking Group…

In the dialog, you can define the bin size.

When done, it’s automatically added the field list, and you can start using this new grouping in your visuals.

More details about binning in the following video:
Top N filter
When analyzing a dataset, you often want to look at categorical data and understand which are your best categories, and which are your worst. With this release, we’ve added a new filter type called “Top N” for categorical filters, which has been one of your most requested features.

You can specify that you’d like to filter by the Top or Bottom number of categories, sorted by a specific measure. You will find the Ton N filter in the filter pane as a Filter Type option for the category field you want to filter down. You add the measure you want to filter with by dragging it into the By value bucket.

More details about top N in the following video:
Include/Exclude data points
When exploring your data, it’s often useful to focus on a specific set of points – for example, outliers that you’d like to investigate further. In addition, you may want to remove specific points because you don’t want to focus on them. You can now select one or more points and right click to include or exclude points in your visual.
Include will filter out all points except for those you’ve chosen to include. Exclude will filter out the points you’ve chosen to exclude.

In the filter pane, you’ll see how many points have been excluded or included. When you expand the filter card, you’ll be able to see which points those were and can remove them from the filter.

More details about Include and Exclude in the following video:
R-powered custom visuals
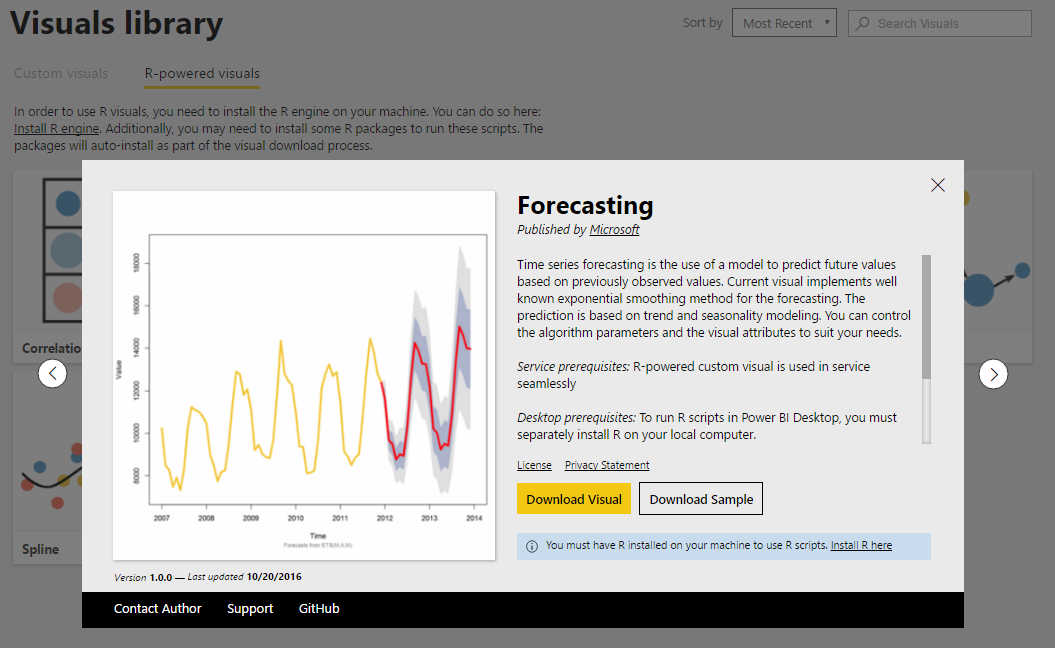
Power BI's R visuals integration adds advanced analytical depth and endless visualization flexibility to your Power BI reports. These reports can then be viewed by all business users on the Power BI web service, not just R experts. However, it still requires expertise in writing R scripts to create these reports. With this release, we have removed this challenge by extending our custom visual experience to work with R visuals. Now, you can simply download a pre-built R-powered custom visual from the custom visual's gallary instead of having to build it yourself. Download R-powered custom visuals from http://app.powerbi.com/visuals under the R-powered visuals tab.
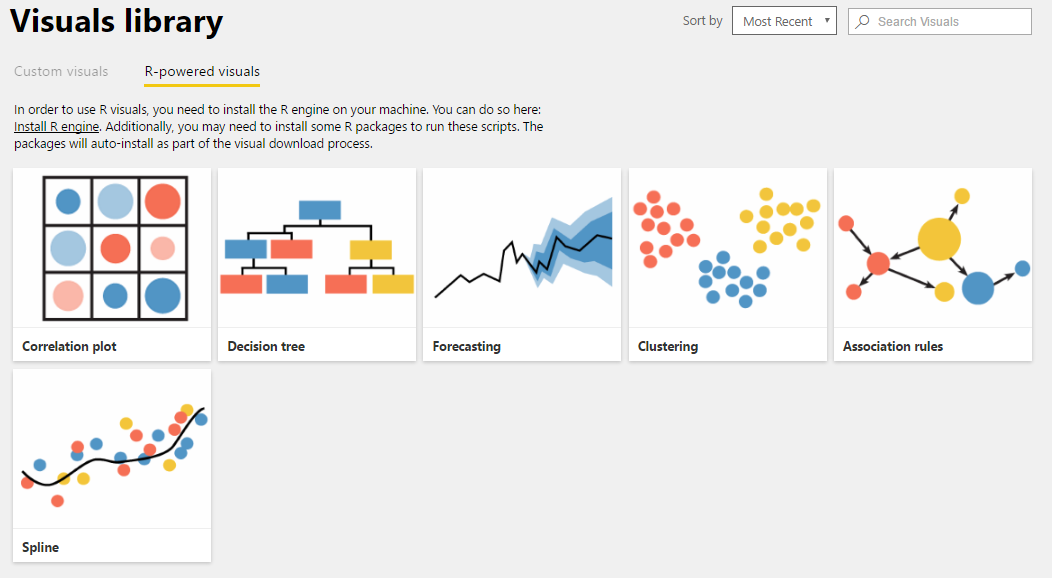
When you select a visual in the custom visuals gallary, you can download the visual or a sample .pbix file using the visual.
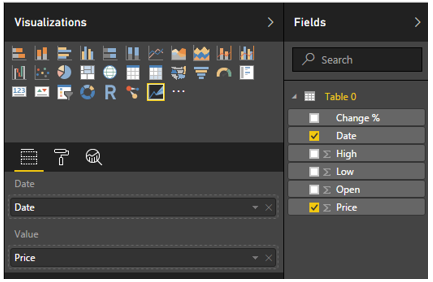
Once you have downloaded the visual you want to use to your computer, you can load it into the Desktop using the normal custom visual import experience.
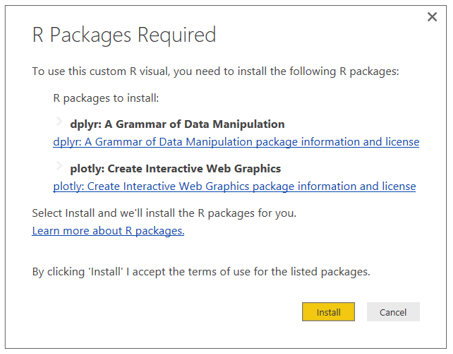
If the visual needs special R packages, the Desktop will prompt you to install them.
From here, you can use it just like a normal visual to do advanced analytics on your data. Once your report is completed, you can publish and share it out with your colleagues.
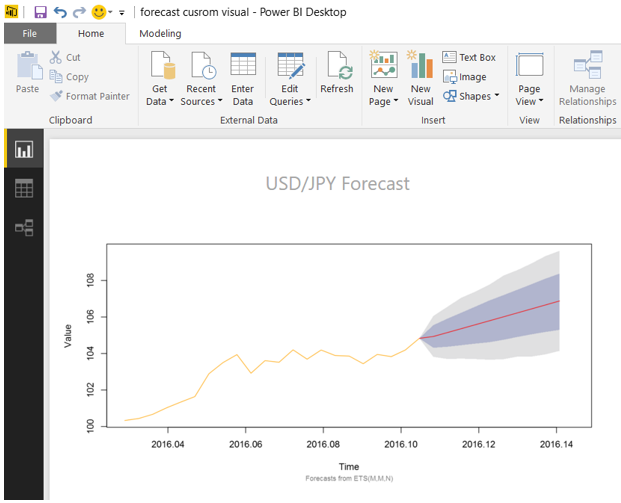
Note that to use R visuals in the Power BI Desktop, you will need to install one of two R engines, either CRAN 3.3.1 or MRO 3.3.1. You won't need to install anything to use them in the Power BI web service.
Data Connectors
Microsoft Dynamics 365 for Financials
One of the new connectors this month allows you to import data from your Dynamics 365 for Financials accounts. The connector can be found under the “Online Services” category.

Once you select this connector, you can specify an OData URL and, optionally, a Company to navigate to available data.

OLEDB
This month we’re enabling connectivity to OLEDB drivers via the new OLEDB connector. In addition to the wide range of out-of-the-box sources already supported, OLEDB greatly increases the number of sources that can be plugged into Power BI.
The new OLEDB connector can be found under the “Other” category within the “Get Data” dialog.

The connector dialog allows you to specify a connection string and, optionally, a SQL statement to execute. If no SQL statement is specified, you will be taken into the Navigator dialog, where you can browse and select one or multiple tables available via the OLEDB driver.

Once this connector is selected, you can specify credentials to use for authentication. Both Organizational Account and Basic (username/password) credential types are supported.
Mixpanel
This month we are very glad to add a new connector for Mixpanel, the leading product analytics platform. This new connector allows users to pull mobile and web analytics data from their Mixpanel accounts, in order to visualize it and create reports within Power BI.
The new Mixpanel connector can be found under the “Online Services” category in the “Get Data” dialog.

Once you select this connector, you can specify credentials (API Secret & Password) to use for authentication.

This allows you to browse available data in your accounts, in the form of tables or parameterized functions, that can be brought into Power BI.

More details about our new data connectors in the following video:
Query Editing Improvements
Support for table parameters in “Invoke Function” dialog
This month we’re enhancing the “Invoke Function” experience to support parameters of type "Table". When invoking a function that accepts a table parameter, either a built-in or user-defined function, you will be able to select an existing table query as the input value to the function.
The following screenshot shows the “Invoke Function” experience for a built-in function, such as Table.Transpose.

This capability is also supported in the “Invoke Custom Function” dialog, allowing you to reference table queries when invoking their own defined functions.

More details about table parameters support in the Invoke Function dialog in the following video:
Other Improvements
Diagnostic information in the “About” dialog
You can now easily copy your session ID and diagnostic info to your clipboard. You can find this diagnostic information under File > Help > About. When working with our support team to get help, this provides an easy way for you to get critical information we need to investigate an issue.

More details about the improved diagnostic information in the following video:
That’s all for this month! We hope that you enjoy this new update and continue sending us valuable feedback about our product. Please don’t forget to vote for other features that you would like to see in the Power BI Desktop in the future.
