


We’re happy to announce the general availability of Query Diagnostics for Power Query in Power BI. Since we launched Query Diagnostics last fall, we really appreciate all the feedback from users about how to improve the usability and functionality of the feature.
Below you will find the summary for Query Diagnostics and the improvements we’ve made since we first released the feature.
Summary
Query Diagnostics is a powerful new feature that will allow you to determine what Power Query is doing during authoring and in some refresh workflows in Power BI Desktop.
Query diagnostics can tell you what sort of operations are being performed and when, what data sources you’re connecting to, the native queries being emitted in certain cases, the time spent on different actions–and much more.
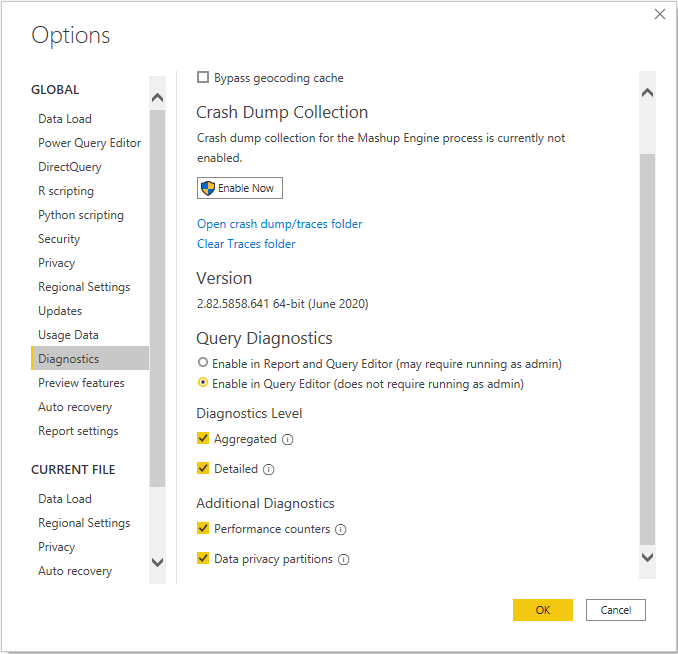
Non-Admin Diagnostics
With our initial release, there were a number of users who were unable to properly run it due to requiring administrative rights (depending on IT policy). We’ve fixed this by adding a non-admin option.
Types of Diagnostics
You’re able to run Query Diagnostics in two primary ways: Diagnose Step, and recording Diagnostics.
Diagnose Step is a more limited feature that allows you to see what’s happening with just your current step.

Recording Diagnostics allows you to record the evaluations by Power Query for any action you take, ranging from applying a filter to a full refresh in Power BI.
Every time you finish recording traces, Query Diagnostics will surface an aggregated table meant for easier readability and decision making, and a more detailed table meant for building visualizations.
Decomposition Tree
Query Diagnostics works great with the new Decomposition Tree feature in Power BI. If you hook it up right, you can easily parse operations and understand how total time breaks down between actions. For example, I use it to understand how time was spent in various emitted native queries.

Upcoming Features
While Query Diagnostics is now no longer in preview, we have many more improvements to come. In the future you can expect to see more information about engine performance, firewall activity, and configurable outputs added to query diagnostics.
As always, we welcome your feedback.