


This month our reporting features focus on accessibility and more flexibility when formatting your charts. With filtering and sorting options, our data view is now more powerful. Several connectors also get major updates this month, including a new driver for our SAP Business Warehouse connector that comes with numerous significant improvements.

Here’s the complete list of June updates:
- High contrast support for reports
- Donut radius control
- Pie and donut detail labels position control
- Format data labels separately for each measure in a combo chart
- Longer phone reports
- SAP BusinessWarehouse connector improvements
- Spark connector now supports Windows Authentication
- OData V4 connector enhancements
- ODBC connector improvements
For a summary of the major updates, you can watch the following video:
Join us at the Microsoft Business Applications Summit
Before jumping into the details, don’t forget to register for the Microsoft Business Applications Summit! Don’t miss the event to connect, collaborate, and pack in as much Power BI learning as possible, July 22-24 in Seattle.

There are going to be many great Power BI sessions and tons of chances to interact directly with the Power BI team.
Reporting
High contrast support for reports
If you're using the high contrast mode Windows settings, your Power BI reports will now respect the color palette you're using. When using Power BI Desktop, we'll automatically detect which high contrast theme you're using and apply those colors across your report, similar to the experience you're used to with other Microsoft products, such as Excel.

In the Power BI service, we'll also try to detect which theme you're using and automatically apply it to your report, but depending on what browser you are using, we may not be able to. If you want to change the theme manually, you can select a high contrast theme under the View dropdown.

Note that if you're using high contrast themes on Power BI Desktop, you’ll still see some areas of the product that aren't using your theme’s colors. We’ll be adding more support for high contrast, along with other accessibility improvements, throughout the rest of this year.
Watch the following video to learn more about high contrast reports:
Donut radius control
Our first formatting update for the month is the ability to control the inner radius of your donut chart. This lets you make the donut slimmer or thicker to get the style you want. You’ll find this option under the Shapes card in the formatting pane.

Pie & donut detail labels position
This month we're also updating our pie and donut charts to support moving your detail labels inside. You can pick between forcing the labels to always be outside or inside or to prefer one position over the other.

If you choose to move your labels inside the pie or donut chart, you can also choose whether the text can overflow past the edge of the shape and if the labels have a background or not.

Watch the following video to learn more about the pie and donut improvements:
Format data labels separately for each measure in a combo chart
Our last formatting improvement this month is an update to data labels in combo charts. Now you can customize individual series. In the Data labels card of the formatting pane, you can turn the Customize series option on to format an individual measure’s formatting options, such as color, display units, and the number of decimal points.

Watch the following video to learn more about the combo chart label update:
Longer phone reports
We've also extended the total length of phone reports this month. If you create custom layouts for your reports to be used in our mobile apps, you'll see that the grid is twice as long as before, jumping from 20 rows to 40.
Watch the following video to learn more about phone reports:
Custom visuals
Organization Chart
The Organization Chart custom visual lets you create a tree view of your data. You can give each node a name, an image, and optionally a link to go to when clicked. The tree is created by giving each node an id and its parent’s id, and the visual will use this to create the tree layout. There are several formatting options as well, such as node colors, orientation, and label formatting.

Download this custom visual on AppSource.
Watch the following video to see the Organization Chart custom visual in action:
China Heat Map
Last month, we had the China Color Map custom visual, and this month we have the China Heat Map visual as a follow up. If you are using geographical data for China, you might want to try out the Chinese Heat map custom visual. This map has several features:
- Offline maps
- One-click switching between a national China map and provincial maps
- Rich visual formatting
- Arbitrarily set the latitude and longitude of the area you want to display
- Custom gradient range fill

Check out this custom visual on AppSource.
Watch the following video to see the China Heat Map custom visual in action:
Modeling
Filtering and sorting in data view
We are very excited to announce the addition of filtering and sorting in the data view. For every column in your model, you can now see the sort direction if it is applied on that column and either filter individual values out or using advanced filtering options for that column type.

Watch the following video to see data view filtering and sorting in action:
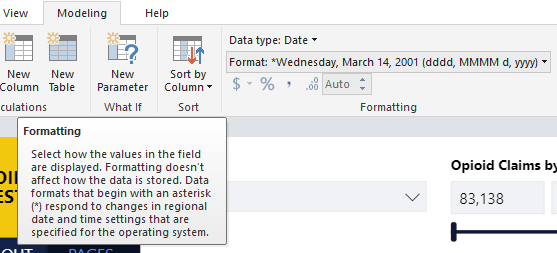
Improved locale formatting
We are vastly increasing the number of specific locales we support for formatting when viewing your reports in the Power BI service. With this update we are adding support for a total of 670 locales. For example, you’ll now see support for Mexico’s variant of Spanish along with many other Spanish variants. In Desktop, we detect and use the "date, time, and number formatting" format set for the operating system. IE and Edge will pass this same OS locale through, but other browsers often have their own, separate, language and region settings.

Make sure to use the default data format for your field if you want the the system locale settings to flow through. You can tell you are using system locale formatting by the * next to the format.
Data connectivity
SAP BusinessWarehouse connector improvements
New driver and improved performance
Starting with this month’s release, the SAP BW connector supports a new implementation option labeled 2.0. Selecting implementation “2.0” in the SAP BW connector dialog while creating a new connection will switch from using the SapClient driver to a new SAP BW driver developed by Microsoft.
These are significant connector improvements that come with the new implementation:
- Improved performance
- Ability to retrieve several million rows of data, and fine tuning through the batch size parameter
- Ability to switch execution modes
- Support for compressed mode, which is especially beneficial for high-latency connections or large datasets
- Improved detection of Date variables
- [Experimental] Expose Date (ABAP type DATS) and Time (ABAP type TIMS) dimensions as dates and times respectively, instead of text values.
- Better exception handling, so errors that occur in SAP BAPI calls are now surfaced.
- Column folding in BasXml and BasXmlGzip modes. For example, if the generated MDX query retrieves 40 columns but the current selection only needs 10, this request will be passed onto the server to retrieve a smaller dataset.
Implementation 2.0 has a new pre-requisite, the SAP .NET Connector 3.0. Download of the connector is available from SAP’s website. Access to this download requires a valid SAP S-user. You are encouraged to contact your SAP Basis team to get this component.
The connector comes in 32-bit and 64-bit versions, and you must choose the version that matches your Power BI installation. At the time of this writing, the website lists two versions (for .NET 4.0 framework):
- SAP Connector for Microsoft .NET 3.0.20.0 for Windows 32bit (x86) as zip file (6.896 KB), January 16, 2018
- SAP Connector for Microsoft .NET 3.0.20.0 for Windows 64bit (x64) as zip file (7.180 KB), January 16, 2018
While installing, in the “Optional setup steps” window, make sure to select the “Install assemblies to GAC” option:

After installing the required component, you must create a new connection to use the new implementation.
- From the Get Data dialog, select either SAP Business Warehouse Application Server or SAP Business Warehouse Message Server.
- You will be presented with the new connection dialog, that allows selection of the Implementation. Selecting Implementation 2.0 will enable the Execution mode, Batch size and Enable characteristic structures options.

- Upon clicking OK, you will be taken to the Navigator dialog, from which the experience is the same as before.

You can learn more about this new implementation of the SAP BW connector by reading the following article: https://docs.microsoft.com/en-us/power-bi/desktop-sap-bw-connector
Improved support for hierarchy variables
We have made improvements to the hierarchy variables input UX in the Navigator dialog and Edit Variables screen, so that when modifying selection for a hierarchy node variable (i.e. US State), dependent variable values fields (i.e. City) are updated to only contain values defined within the selected hierarchy node.
Spark connector now supports Windows Authentication
We’re enhancing the Spark connector this month by adding support for Windows authentication. Upon specifying a server to connect to, you can now provide Windows authentication credentials in addition to the previous Basic (username/password) option.
Windows authentication support allows you to specify “current” or “alternate” user credentials. Additionally, you can specify the Realm, Host Fully-Qualified Domain Name and Service Name parameters, which are required in order to establish the connection to Spark clusters.

OData V4 connector enhancements
This month we’ve made significant improvements to our OData connector in order to provide richer support for OData V4.
-
Improved support for complex types: The new experience for complex-typed properties is now much like that for navigation properties. Complex singleton properties can now themselves contain navigation properties, and complex collections are now imported as nested tables.
-
Open type navigation columns: While the existing OData connector has long supported importing extra data properties from an OData feed as open type columns, the enhanced connector extends this to also importing extra navigation properties, whether dynamic or from a derived type. In many cases we will still be able to fold even after following these navigation properties.
-
Improved support for custom URLs: Users who prefer to specify OData query options manually will find that the enhanced connector adjusts the type of the imported table according to the response.
-
Significant performance improvements: Loading feeds with many navigation properties has been massively sped up.
-
Greater resiliency: If for any reason a folded query fails, the enhanced connector will retry with less folding. This allows more queries to succeed without completely giving up on the improved performance from folding.
ODBC connector improvements
The ODBC connector has been improved this month in a couple of ways:
Folding support for Top Rows
With this month’s release, “keep top rows” operations will be pushed down to the ODBC driver, which may improve performance of the connector if the driver and underlying data source support the “top” operator.
Ability to filter navigation by DSN catalog
If the DSN or connection string specified in the ODBC connector dialog includes a DSN catalog, Power Query will narrow down the list of tables exposed in the Navigator dialog accordingly.
Other
National cloud selector
Power BI is currently available in three separate national clouds, which offer the same levels of security, privacy, compliance and transparency as the global version of Power BI, combined with a unique model for local regulations on service delivery, data residency, access, and control. If your account happens to be provisioned in more than one cloud, you can now choose the cloud you want to use when signing into Power BI Desktop.
That’s all for this month! We hope that you enjoy these updates and continue sending us your feedback. Please don’t forget to vote for other features that you’d like to see in the Power BI Desktop. You can also download the .pbix file I used, and if you’re looking for a similar design for your reports, I was using the Sunset layout from PowerBI.Tips.
Join us at the Microsoft Business Applications Summit
Finally, remember to register for the Microsoft Business Applications Summit! Don’t miss the event to connect, collaborate, and pack in as much Power BI learning as possible, July 22-24 in Seattle.

I’m excited to meet many of you there!